Young kids can learn to think like data scientists—yes, really.
In the TechnoMe course, students explore data through hands-on, age-appropriate activities that make learning fun and meaningful. Data analysis for kids is a powerful way to build essential computer science skills early, while also sparking curiosity and developing logical thinking. As they explore patterns and trends, students begin to think critically about the world around them.
This article is a follow-up to my previous blog about the newly released version of TechnoMe. Read all about the updates here!
Data Analysis for Kids
TechnoMe is a primary course in which students create an All About Me slideshow. They build presentation skills as they design a mini biography. On completion, they share their creations with their peers. They reflect on similarities and differences with their classmates, developing collaboration and a respect for multiple perspectives.
When TechnoKids set out to update this popular course, we set a target to include key computer science objectives as well. Using the CSTA K-12 Computer Science Standards for grades K-2, we were able to align TechnoMe with several standards, including:
Data & Analysis
- Store, copy, search, retrieve, modify, and delete information using a computing device and define the information stored as data.
- Identify and describe patterns in data visualizations, such as charts or graphs, to make predictions.
Exploring STEM Activities to Build Data Skills
The course begins with students designing slides about themselves, their likes, and their goals. For the final slide, they create a graph to show the number of adults, children, and pets in their home.
To begin, students explore a pictograph and answer questions about the data. They practice analyzing and summarizing information. Next, they collect information about their own families—counting the number of adults, children, and pets—and organize it in a simple table. Finally, they use a slide template to create a visual graph, drawing shapes to represent each family member.
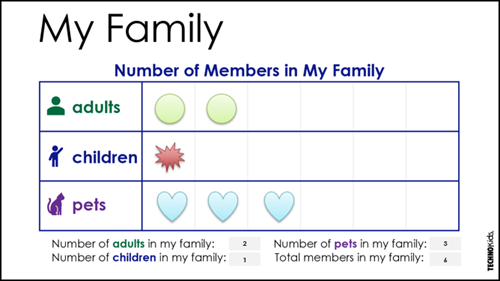
Students study the data and complete the summary statements.
Challenge Students with a Snack Survey
In this optional extension activity from TechnoMe, students take on the role of party planners. They practice collecting data and creating a pictograph.
- Collect and Organize Data
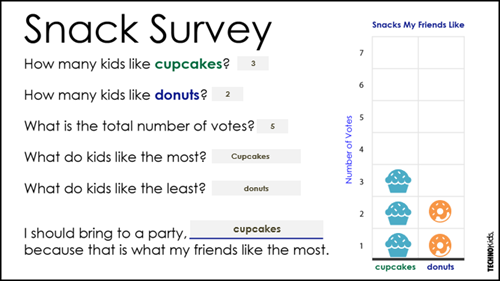
Working in teams, students survey their classmates with the question: “Do you like cupcakes or donuts?” Each response is recorded in a table, giving them hands-on practice with data collection. - Create a Custom Pictograph
Next, students use the Survey slide template to design a visual graph. Instead of basic shapes, they search the Icon gallery for a symbol that matches their data. They also learn how to style the icon and use the Duplicate tool to easily copy and paste multiple icons into the graph. - Summarize and Predict
To finish, students calculate totals, summarize their findings, and make a prediction: Which snack is the best pick for the party?
This activity builds confidence with data analysis while keeping learning creative and collaborative—perfect for reinforcing computer science and critical thinking skills in a fun, memorable way.
Inspire Young Minds with Data Analysis for Kids
The refreshed version of TechnoMe is the perfect way to blend data analysis for kids into your curriculum. It combines presentation skills, digital citizenship, and computer science in one fun, creative project that keeps young learners engaged while building essential digital literacy skills.
Ready to spark curiosity and build student confidence with data? Explore this sample of the TechnoMe Teacher Guide and bring the power of data analysis to your classroom today.