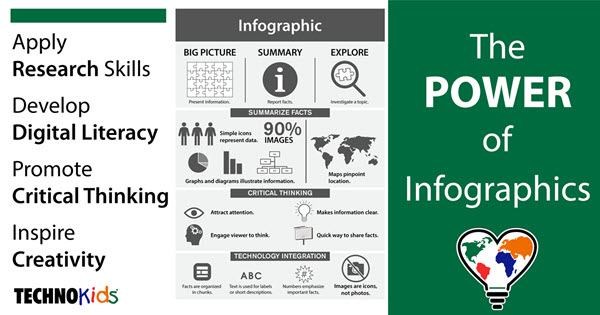
As an alternative to report writing or giving a presentation, an infographic is a compelling way for students to demonstrate their learning. Due to its visual nature, an infographic portrays facts, data, images, and a call to action in a convincing and appealing format. When we teach students the tools for designing their own infographics, they acquire a variety of essential skills. Here’s a list of the values of teaching students how to build an infographic.
Apply Research Skills
In order to present the facts and images that are fundamental for an infographic, students need to build search skills. In a couple of recent blogs, we outlined some tips for teaching explicit strategies for online research. Limited reading and scanning skills, irrelevant sites, advertising, and biased websites are stumbling blocks to students finding reliable, appropriate results quickly. If we teach them how to search, they will achieve greater success in finding trustworthy information fast. Making an infographic is a great way for students to boost their search skills.
Develop Digital Literacy
An infographic can be designed for almost any subject area. Topics in science, geography, visual arts, history, and language arts can all be expressed using images and brief text. Multiple technology skills are developed:
- graphic design
- digital citizenship
- online search strategies
- communication and word processing
- web-based publishing
Promote Critical Thinking
An infographic has very limited text. When creating this type of document, a student needs to evaluate all the information and determine which facts are most important and engaging. An infographic has different sections, so they need to organize the layout in a logical way. Finally, the headings of each block of information must be interesting to capture audience attention. Therefore students must synthesize, paraphrase, and describe the topic in brief but intriguing titles. These skills are in the top two levels of Bloom’s taxonomy, evaluation and synthesis, where students master the most complex learning tasks.
Inspire Creativity
Infographics are lots of fun to create! Choosing layouts, picking color themes, drawing icons,
listing fun facts, making an image carousel, and displaying surprising numerical data are just some of the elements to design and construct. Students find it highly motivating to make an original infographic. Spark the interest of students from Grades 6 and up with a novel assignment. Inspire them to make unique infographics that both demonstrate their learning as well as inform others.
Develop Real World Communication Techniques
An infographic presents a topic using universally recognized symbols and images. Text is brief and enticing to attract and hold the viewer’s attention. Students need to understand the topic, but they also have to convey it in an authentic way that will captivate readers. An infographic is likely to be web-based, so it should mirror contemporary media. There is a lot of information to compete with, so it must be accurate and convincing. The student isn’t writing a report for the limited audience of one teacher. It is being written for the public. Quality, grammar, vocabulary and tone are critical with a global audience.
Learn How to Create an Infographic with TechnoEarth
TechnoKids’ newest project, TechnoEarth, instructs students how to build an infographic about an environmental issue. They play the role of environmental stewards as they design an interactive infographic about an important problem. They learn how to outline the cause, harmful effects, stakeholders, location, and solutions using a highly engaging format. Learn more about TechnoEarth here.

