
Environmental literacy is an essential social studies topic. And middle school is the ideal time to nurture eco-awareness. By teaching complex issues such as global warming and pollution at this age, we can empower students to shape their perspectives, make wise choices, and develop good habits. In the TechnoEarth project, students create and exercise the power of infographics to publish a compelling call to action. They take on the role of environmental stewards.
To teach these essential messages, educators need impactful resources. TechnoEarth seamlessly integrates technology skills with environmental education. Students follow illustrated, step-by-step instructions to create a powerful interactive publication to inform and inspire others.

Make Learning Relevant
TechnoEarth activities are active, hands-on learning tasks to actively engage students in an environmental campaign. The infographic they make is interactive, with powerful images, provoking text, and interesting features to attract the attention of viewers. It is a web-based publication that outlines the causes, harmful effects, and solutions to an environmental problem. Students may select a local issue of personal importance, or pick a global problem. The goal is to use the power of infographics to visually combine images, symbols, and minimal text to effectively communicate critical information.
Teacher Resources Included
The TechnoEarth project includes everything teachers and students need to complete the activities:
- Teacher Guide – Curriculum guide with teaching strategies, lesson plans, and helpful tips
- Student Workbook – PDF instructions can be printed or used digitally
- Assessment Tools – Checklists, marking sheets, review questions, and skill reviews for extra practice
- Samples – Completed infographics to inspire creativity
- Fact Cards – 13 environmental issues outlined in single sheets to aid in research
- Extension Activities – Optional lessons for enrichment
- Parent Letter & Certificate – Resources to communicate and celebrate learning
Session 1: Students as Environmental Stewards
To start, students critically review sample infographics. Then they select a topic of their choice, making each infographic in the class unique. To prepare, they complete a planner outlining causes, effects, interesting facts, location, stakeholders, and solutions. To build research skills, students list resources used. Finally, a checklist is applied to ensure that they are ready to start building the infographic.
Session 2: Showcase Causes and Effects
To make the interactive publication, students use Google Sites. They build sections using color and dividers to attract attention. To begin, they list the causes and harmful effects of an environmental problem. With catchy headlines and simple clip art, they raise awareness and understanding of the problem.
Session 3: Create a Rotating Slide Deck
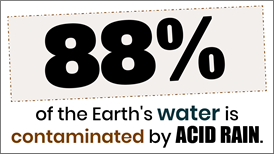
Next, students create visual impact. They use a prominent big number fact to emphasize the scale of the problem. Following illustrated directions, they make a colorful word art graphic. Then they outline the stakeholders who have various interests and perspectives of the issue, often at opposite viewpoints. These unique pictures, symbols, and facts are combined into a rotating slide deck that is sure to convince the audience of the scope of the problem.
Session 4: Map the Problem
Students make the next part of the infographic using Google My Maps. They learn to use this tool by dropping pins on maps to showcase locations where the environmental issue is occurring. Each marker shows a fact and a photograph.

Session 5: Suggest Solutions
In this section, students showcase their creativity. They use Google Drawings to design their own icons. These simple graphics represent organizations that are actively involved in solutions to the problem. A link is inserted to invite viewers to get involved.

Session 6: Display the Power of Infographics
As a culminating activity, students unveil their work by publishing the infographic using Google Sites. They host an Earthkeeper’s Conference and invite others to comment and reflect on their work.

Foster earth-friendly practices with TechnoEarth, an engaging technology-based project. By combining the power of digital skill building with knowledge about critical environmental topics, students build essential competencies in a compelling, real world activity.