You can make a pivot table of data from Google Forms to compare questionnaire responses. When students create a survey, they will likely ask demographic questions about the people answering the questionnaire. Demographics include data about a person such as age, gender, grade, class, or role such as student, parent, or teacher. These factors may influence what a person does, thinks, or believes.
- Do grade 6 students have a different opinion than grade 7 students?
- Do boys pick the same answers as girls?
You can find out!
The answers of each subgroup can be compared using a pivot table. A pivot table allows you to place data into rows and columns to summarize information in a spreadsheet.
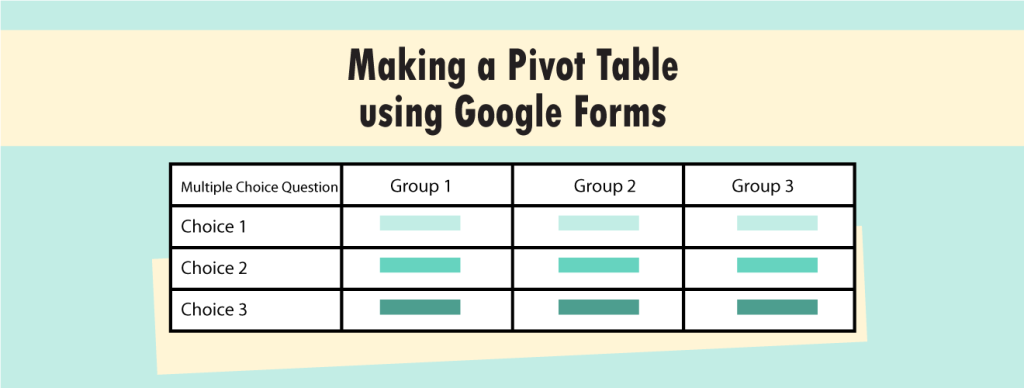
To create the pivot table, drag a multiple choice question into a row and the demographic question into a column. You will then get the program to count how many people in each subgroup selected a particular answer to the multiple choice question using COUNTA.
For example:
How to Make a Pivot Table from Google Forms Data
- Open the spreadsheet with the responses.
- From the Data menu, select Pivot table report.
- Add the choices from the Multiple Choice question to the pivot table:
- In the Rows section, click Add field.
- Select the multiple choice question.
- Add the subgroups from the Demographic question to the pivot table:
- In the Columns section, click Add field.
- Select the demographic question.
- Count the number of people that picked each choice:
- In the Values section, click Add field.
- Select the multiple choice question.
- In the Report Editor pane, click the Summarize by: arrow. Select COUNTA.
- The table should look something like this:
- Analyze your data:
- What demographic question did you use?
- List the subgroups or options list for the demographic question.
- Write down the multiple choice question that you used to analyze the data.
- What were the choices for the multiple choice question? List them.
- Were the answers the SAME for each subgroup?
- NO – describe the differences
- YES – generalize the findings to the population because demographic data did not influence answers
- Does this information change your research conclusions?
- To return to the spreadsheet, click Form Responses 1 at the bottom of the window.
Pivot tables allow you to analyze selected parts of your data to make conclusions. Do the general summary conclusions apply to the entire population? Or, does the pivot table let you see how specific portions of the population show significantly different results?