
Want to learn how to make a pictograph with Google Slides? Keep reading! This blog post explains how to use the drawing tools in Google Slides to transform a slide into a pictograph.
What Is a Pictograph?
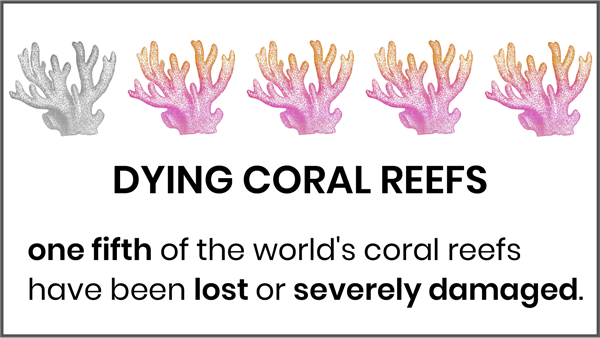
A pictograph is a graph that is made from pictures. Each image represents a value. It could be a fraction, ratio, percent, price, or other unit of measure.
Select a Key to Represent Each Value
The first thing you need to do when making a pictograph is decide upon the key you will use to represent the data. For example:
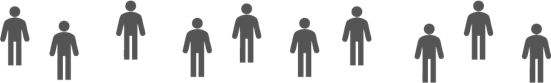
one body = ten million people
one piece of coral = one fifth
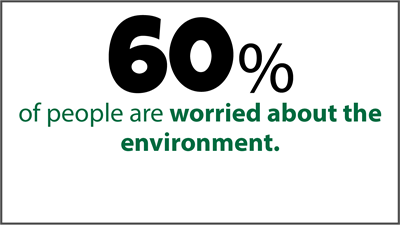
one fish = 10%
Make a Pictograph Using Google Slides
Follow the step-by-step instructions to learn how to make a pictograph using Google Slides. Be creative!
1.Open Google Slides.
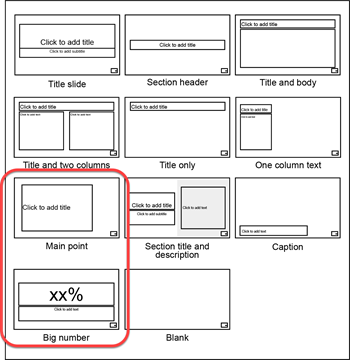
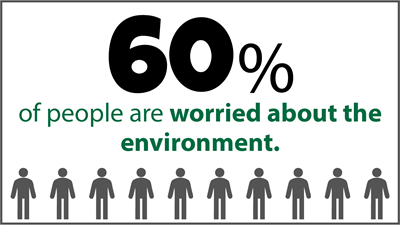
2. Click the New Slide arrow. Select Main Point or Big Number.
3. In the text boxes, type the fact. Format the text to make the number stand out.
4. Insert an image to represent the value. It should be a simple clip art, symbol, or icon:
- Click Insert Image.
- Click Search the web. Type a search word.
- Click on an icon you like. Click Insert.
- Resize and move the icon.
5. Copy and paste the image to create a group:
- Select the image.
- Press CTRL + D on the keyboard, to duplicate the image.
- Continue to duplicate, until there are enough images to represent the number.
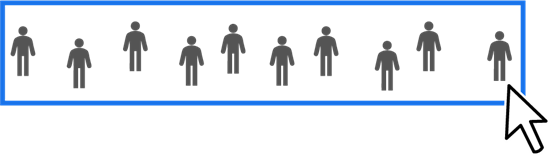
6. Select the images on the slide:
- Place the first and last image where you want them on the slide.
- Click and drag around the images to select them all.
7. Arrange and distribute the images:
- From the Arrange menu, click Align.
- Select Top, Middle, or Bottom.
- From the Arrange menu, click Distribute. Select Horizontally.
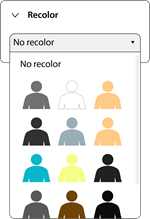
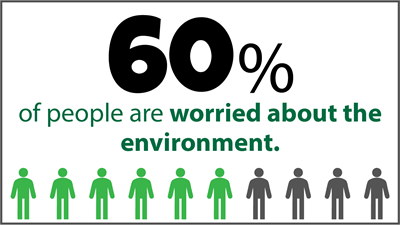
8. Recolor some of the images to show a fraction, ratio, or percent.
- Select the images to be a different color.
- Click Format options.
- Click the Recolor arrow. Pick a color.
Crop An Image to Show Part of a Value
Your value might be 65 thousand people. What do you do? You will need to crop part of an image to remove a section.
- Select the image to be cropped.
- Click Crop image.
- Drag a handle to remove part of the shape. The part outside the black crop lines will be trimmed away.
- Click Crop image again.

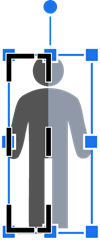
Make One Image Look Like It is Two Colors
- Select an image. Press CTRL + D on the keyboard to duplicate it.
- Crop the pasted image.
- Recolor the cropped image.
- Drag it over top of another image, so that they look like one piece.

Environmental Education Lessons for Grades 6-9
The instructions for how to make a pictograph are modified from the extension activity in the TechnoKids project, TechnoEarth. In the lesson students follow instructions to create a pictograph about an environment topic. It is a meaningful way to demonstrate learning.
Download How to Make a Pictograph Lesson
Are you interested in environmental education? In TechnoEarth, students design an interactive infographic to raise awareness for an environmental issue. Visit TechnoEarth to learn more details about this engaging technology unit that places students in the role of environmental stewards.